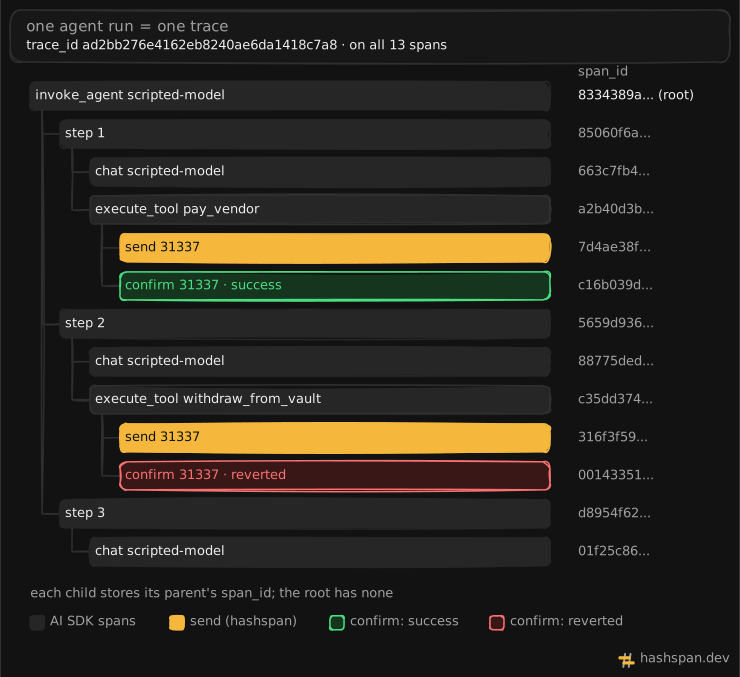
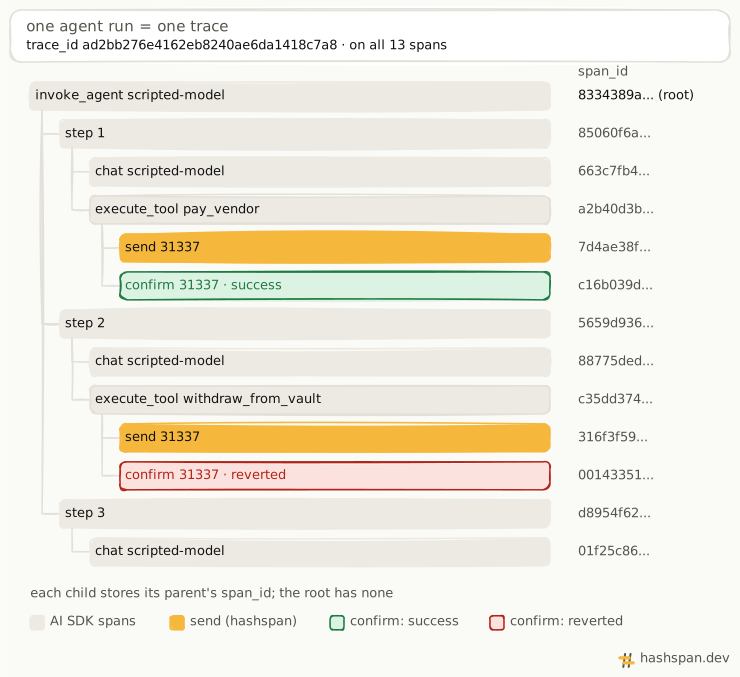
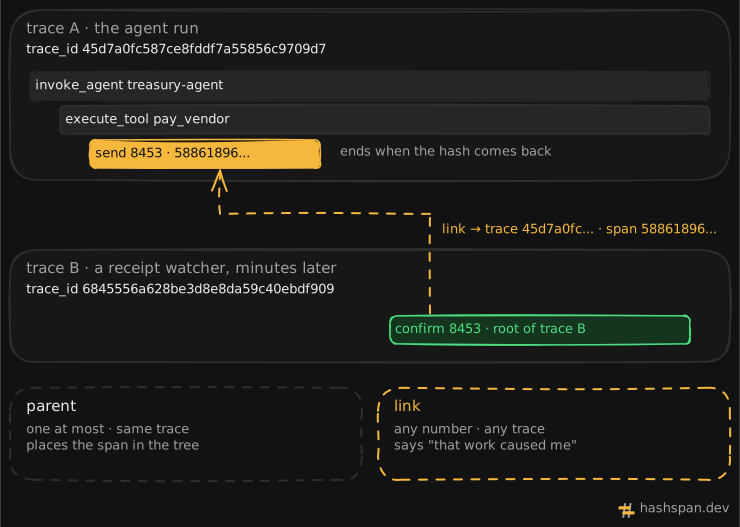
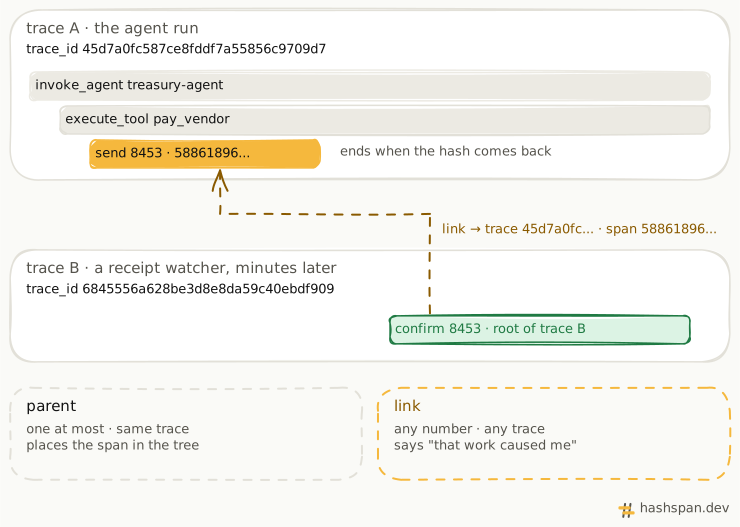
Run the same agent code twice. Once, send 8453 sits under its tool call. Once, it’s a trace of its own with no parent. The only difference is one line of setup.
Two kinds of propagation
| Inside one process | Between processes | |
|---|---|---|
| Problem | Which span is active after an await? |
Which trace does this request belong to? |
| Solved by | A context manager | A propagator |
| In Node.js | AsyncLocalStorage |
traceparent header (W3C Trace Context) |
The context propagation docs define propagation as moving context between services and processes. In Node.js, the in-process half matters just as much, because nearly every agent tool awaits something.
What breaks across await?
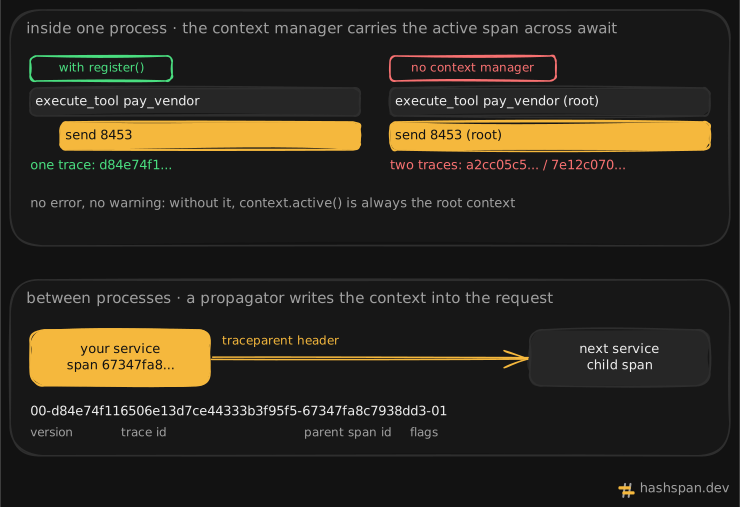
A tool that awaits a signer, then starts the send span. The send span takes whatever context is active at that moment:
import { context, propagation } from '@opentelemetry/api';
async function sendTransaction() {  await new Promise((r) => setTimeout(r, 10)); // e.g. signing  tracer.startSpan('send 8453').end(); // parent: whatever is active now  const headers: Record<string, string> = {};  propagation.inject(context.active(), headers); // what an RPC call would carry  return headers;}
const headers = await tracer.startActiveSpan('execute_tool pay_vendor', async (tool) => {  const h = await sendTransaction();  tool.end();  return h;});
With only a tracer provider set, there’s no context manager:
send 8453 7e12c070c16890b48f9cde6127b8a2d2 (root)execute_tool pay_vendor a2cc05c5c8e58797af0ba58aaf725791 (root){}With provider.register(), which installs an AsyncLocalStorage context manager and the W3C propagators for trace context and baggage:
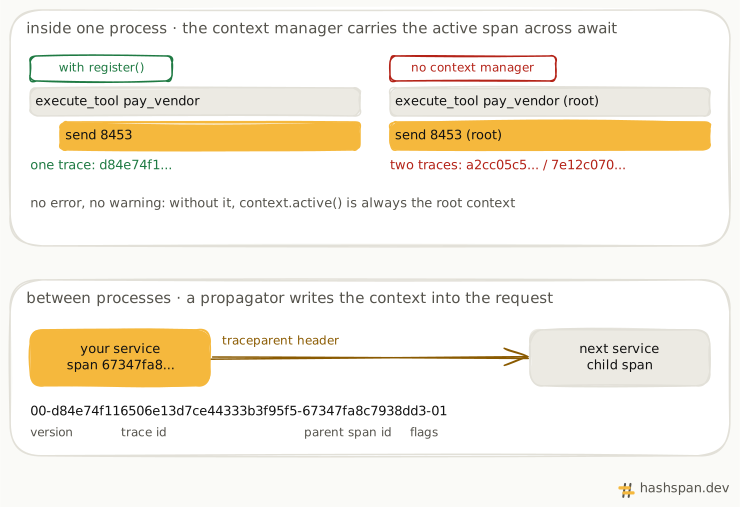
send 8453 d84e74f116506e13d7ce44333b3f95f5 67347fa8c7938dd3execute_tool pay_vendor d84e74f116506e13d7ce44333b3f95f5 (root){ traceparent: '00-d84e74f116506e13d7ce44333b3f95f5-67347fa8c7938dd3-01'}Without a context manager, context.active() always returns the root context (JS context docs). No error, no warning. Just two traces where you expected one, and no header for the next service.
What’s in traceparent?
00-<trace id>-<parent span id>-<flags>. The trace ID is the one the whole run shares. The span ID is the span that made the call. Flags 01 means sampled. The receiving service starts its spans as children of that span.